

About CGC™
Fully interactive cement database and intelligence platform
The main objective of the CGC™ is to provide cement professionals worldwide with up-to-date, accurate and extensive cement-related data, intelligence, and insights.
The CGC™ Database explained
All the information and insights you’ll need in one place

CGC™ Database
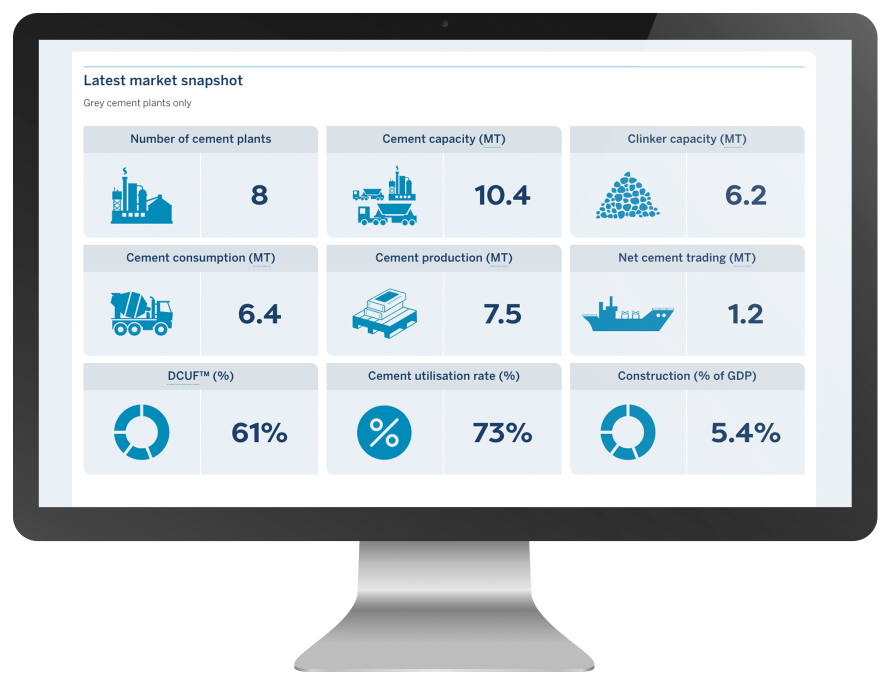
Country dashboard
Details on current situation
- Number of cement plants
- Cement capacity in million tonnes
- Clinker capacity in million tonnes
- Cement consumption in million tonnes
- Cement production in million tonnes
- Net cement trading
- Cement utilisation rates
- Domestic Capacity Utilisation Factor DCUF™
- Construction as a percentage of GDP
- Consolidation index
- Clinker to cement ratio
- Bulk cement as a percentage of total consumption
- General data (Region, Area, Population, Urbanisation rate, Currency, Economy size, GDP per capita, Official language)
View or download
The user is able to download the dashboard in pdf format.
Test drive our system
CGC™ Database
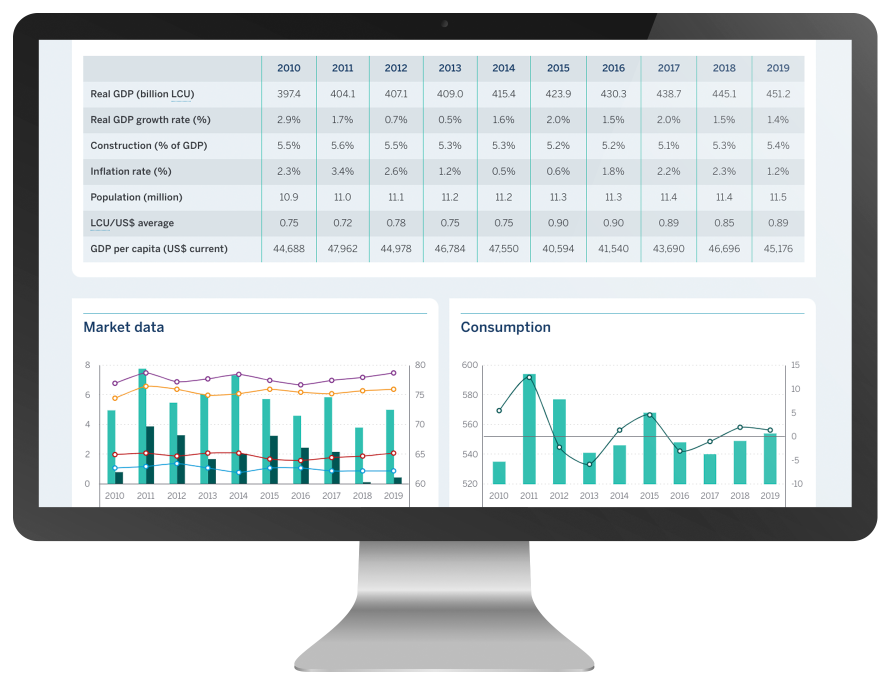
Market and economic data
Ten years of accurate data in tabular and graphical form for:
- Cement consumption in million tonnes
- Cement consumption growth rate (%)
- Per Capita Consumption in kg
- Cement production in million tonnes
- Imports in million tonnes
- Exports in million tonnes
- Cement Utilisation rates
- Domestic Capacity Utilisation Factor – DCUF™
- Macroeconomic data (Real GDP, Real GDP growth rate, Construction as a percentage of GDP, Inflation rate, Population, Local currency v US$, GDP per capita US$ current)
Compare markets and download data
The user is able to compare up to five markets for each year and each data point. The user is able to download the data in an Excel file.
CGC™ Database
Manufacturing facilities data
Interactive data:
- Interactive map with all plant locations and data showing:
- Local company name
- Location
- Type of plant
- Type of product
- Cement capacity
- Ultimate control company
- Tabular presentation of:
- Total number of plants by type
- Total cement capacity in million tonnes
- Total number of companies
- Average plant size in million tonnes
- Table with all cement plants in the country
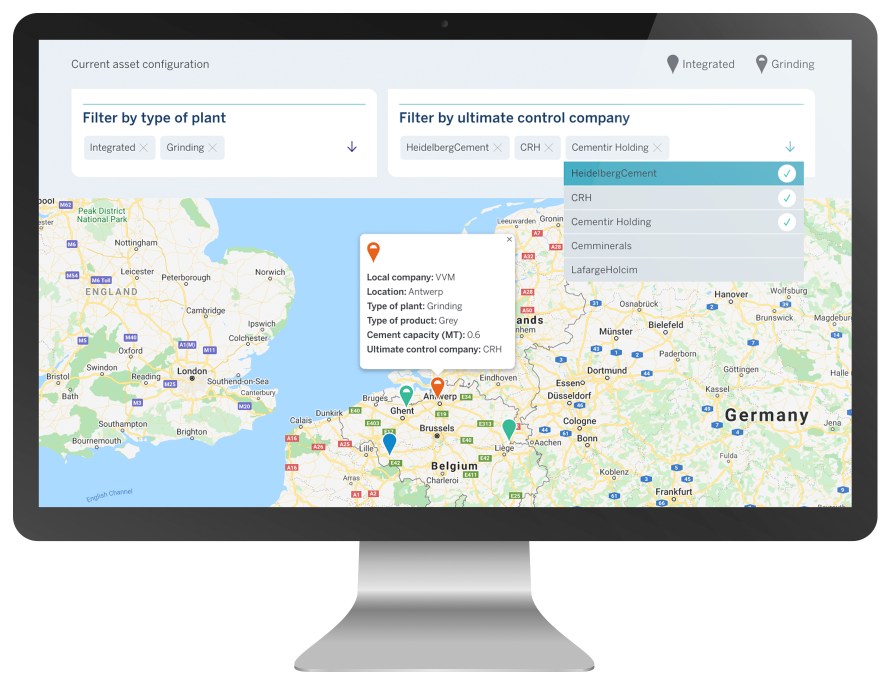
Filter interactive map
The user is able to filter the cement plants shown on the map by type of plant and ultimate control company.
Please note that the current version excludes manufacturing facilities in China. See FAQs for details.
An expanding platform
The CGC™ is a continually updated platform with data and insights inputted as soon as they become available. The CGC™ covers the 90 largest markets in the world representing around 95% of global consumption. The CGC™ is an “organic” platform and is capable of being expanded and amended to suit the sector’s needs.

CemBR Forecasts
Forward looking report
The CemBR Forecasts is a once per year report published in Q4 of each year. The report provides extensive data, insights and projections needed by cement professionals to prepare their budgets or plan investment projects.
The CemBR Forecasts report covers six regions with their largest markets. It draws data and insights from the 90 largest cement markets in the world representing over 95% of global cement consumption. The report is divided into three sections: the global outlook, the regional trends, and the country-by-country analysis. The country-by-country analysis examines the sixty largest cement markets in the world.
Five year projections for
- GDP projections
- Population projections
- Demand projections
- Supply – demand balance
- Excess / deficit capacity
- Domestic Capacity Utilisation Factor (DCUF™)
- Global and regional summary & forecasts
Insights
- Capacity changes (additions – closures)
- M&A activity
- General market narrative
- Global and regional averages of key figures and comparisons
Contact us for more information
Contact us